
Dashboards & Reporting
Audit-ready training reports
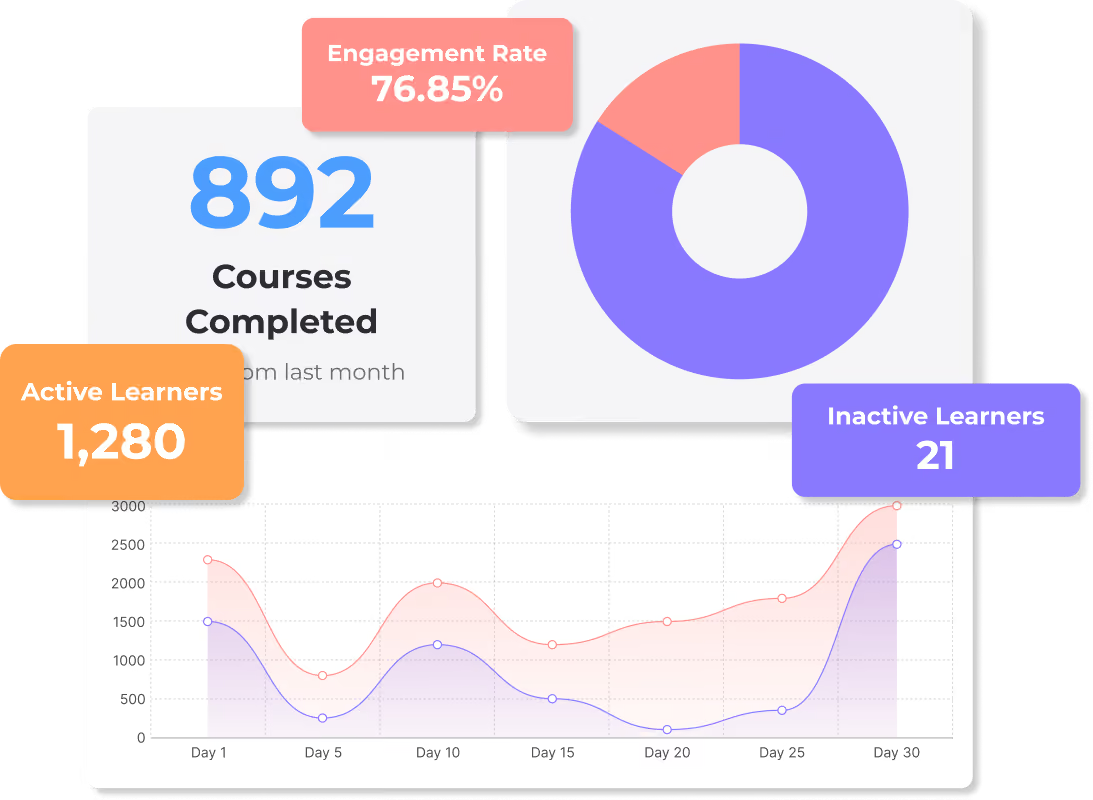
etrainu’s dashboards show completions, engagement and course performance across your organization, so you can step in early and pull the evidence you need for an audit or a leadership report.







Know where everyone’s training stands
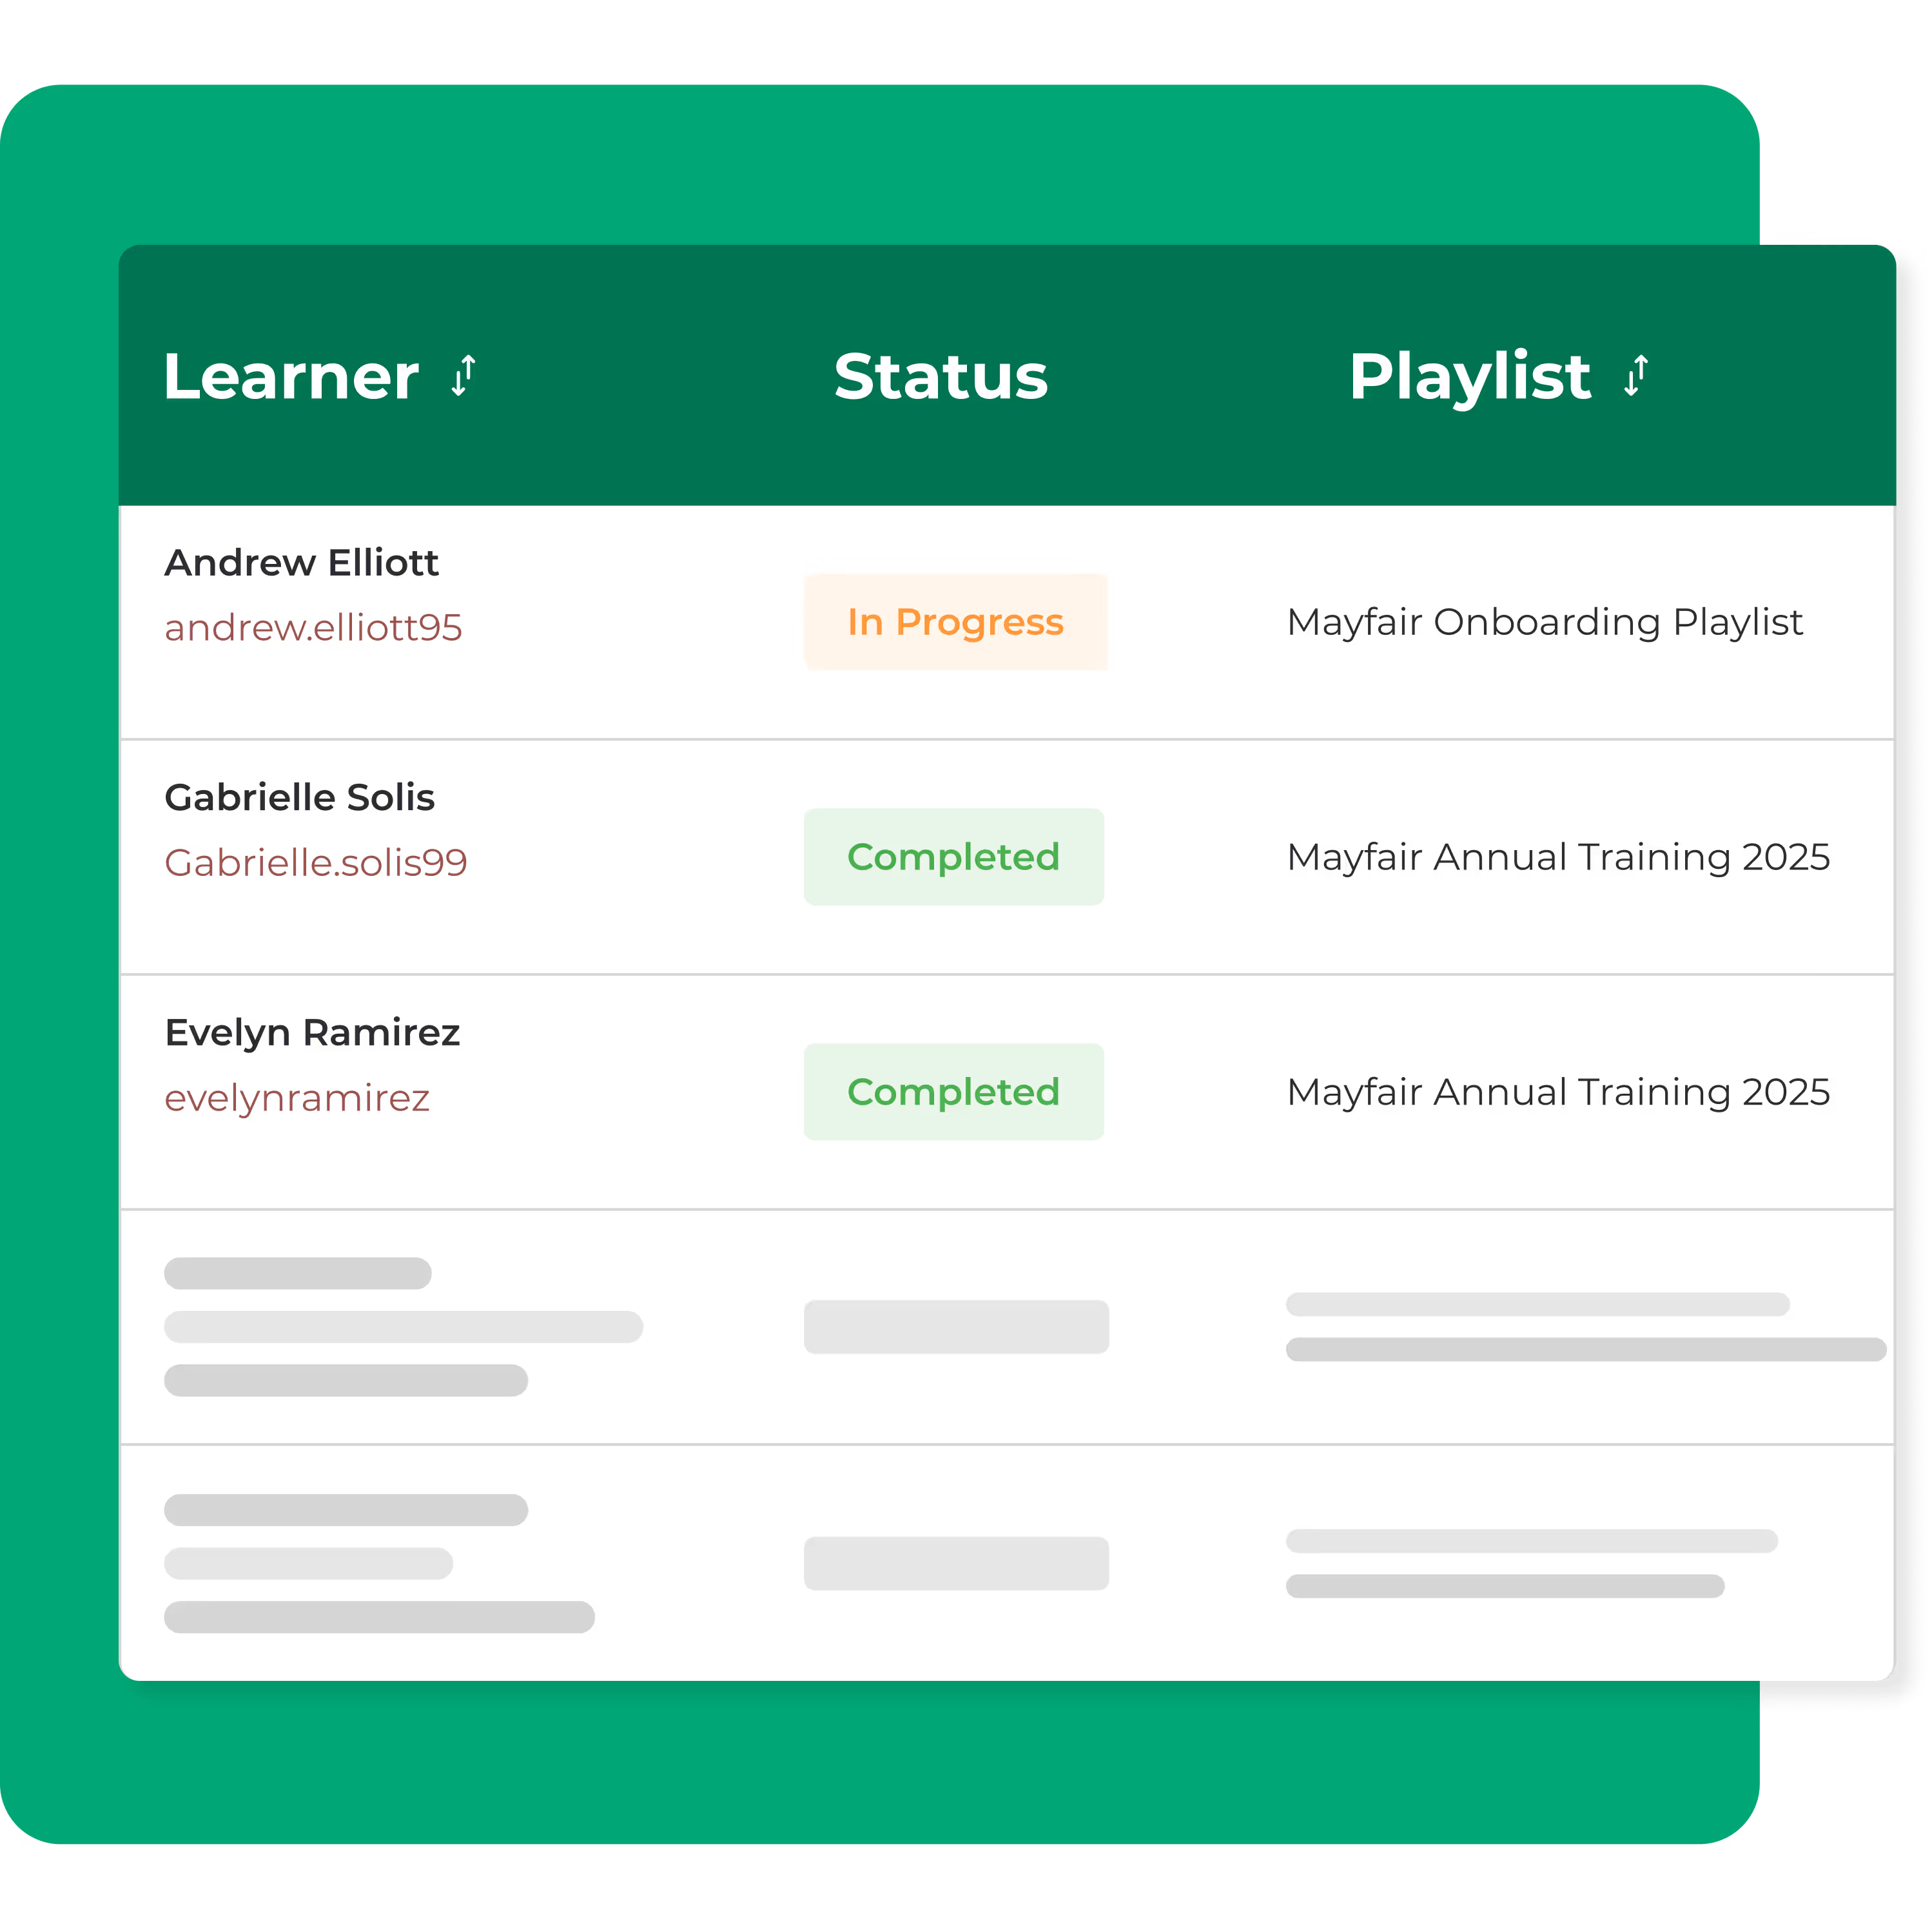
The course status report shows you, person by person and course by course, who has finished, who’s in progress and who hasn’t started. Use the dashboards when you want the trends at a glance.
You get:
- Each learner’s progress, engagement and completion status
- Completion rates for every course over time
- An organization-wide snapshot of activity and engagement
- Records that support audits, reporting and compliance
- How much time learners spend on each course, so you can see where people move quickly and where they get stuck
Show auditors and leadership what your training is achieving
Pull up completion rates, progress by team and course performance in a few clicks. When an auditor asks for evidence or your CEO asks what the training budget delivered, the answer is already on your dashboard.

Understand how learners are engaging
The Learner Overview helps you see how your people are progressing, who needs support, and where engagement may be slowing. It is the insight you need to intervene early and support your team.

Export detailed reports for any team, site or course
When you need to get hands-on with your data, our reporting tools let you dig further. Run exports, analyze specific segments, and uncover insights beyond the dashboards.
BOOK MY DEMO
See Dashboards and Reporting in action
See Dashboards and Reporting in action
We’ll set up the dashboards around roles and teams like yours, show you how to pull an audit report, and walk you through how managers spot learners who are falling behind.