Dashboards & Reporting
Clarity that drives action
The visibility you need to make informed, confident decisions about your learning programs, and demonstrate impact.


Explore insights that actually matter
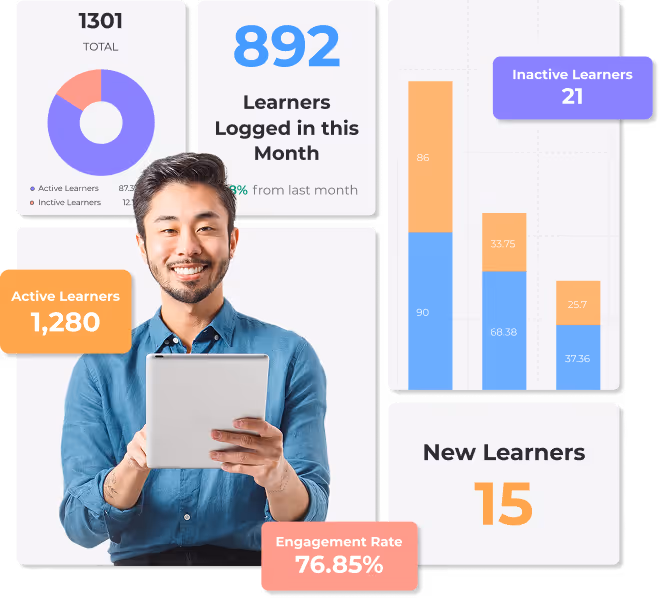
See at an instant your organisation’s learning and development performance. No unnecessary charts, no complicated exports, no data overload.
You get:
- A high-level organisational snapshot to quickly understand overall performance and trends.
- Insight into individual learner activity, engagement, and progress.
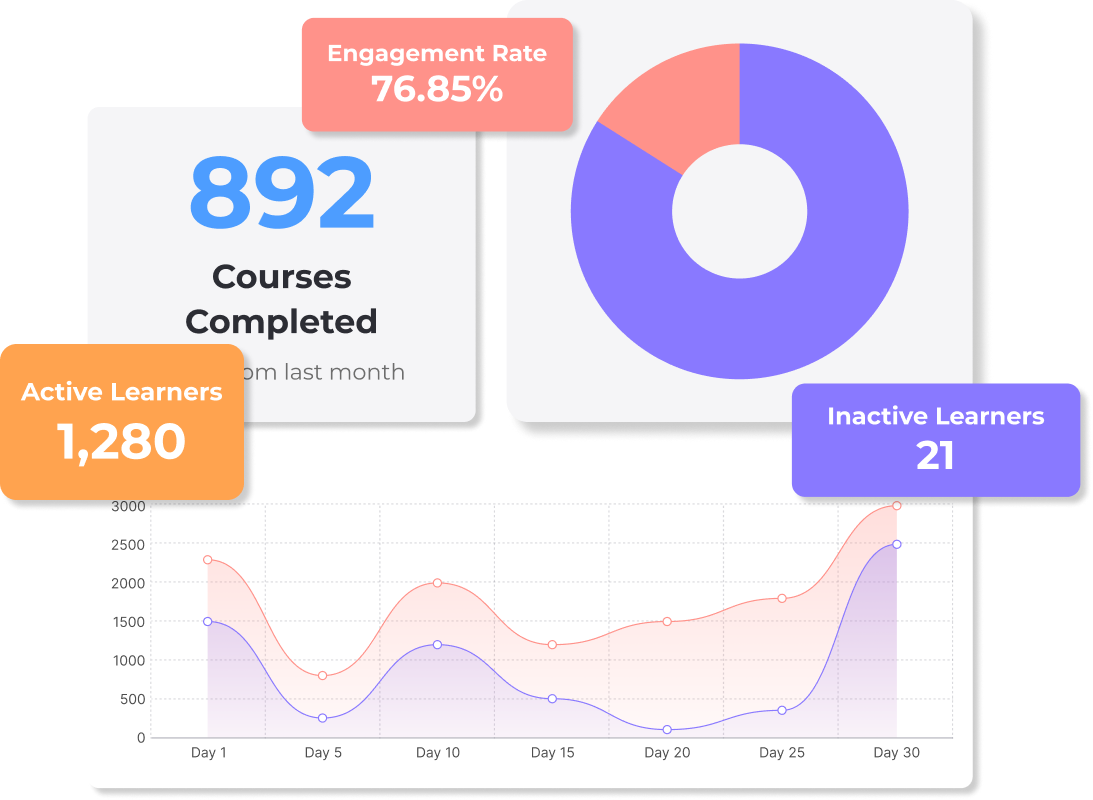
- Clarity on which courses are performing over time.
- Insights that support audits, reporting, and compliance.
Demonstrate success without a sweat
Need to showcase the impact of your learning program? With a clear view of performance, proving success becomes simple. Whether you’re reporting to leadership or preparing for an audit, the dashboards make it easy to highlight progress, demonstrate value, and communicate outcomes with confidence.
.avif)
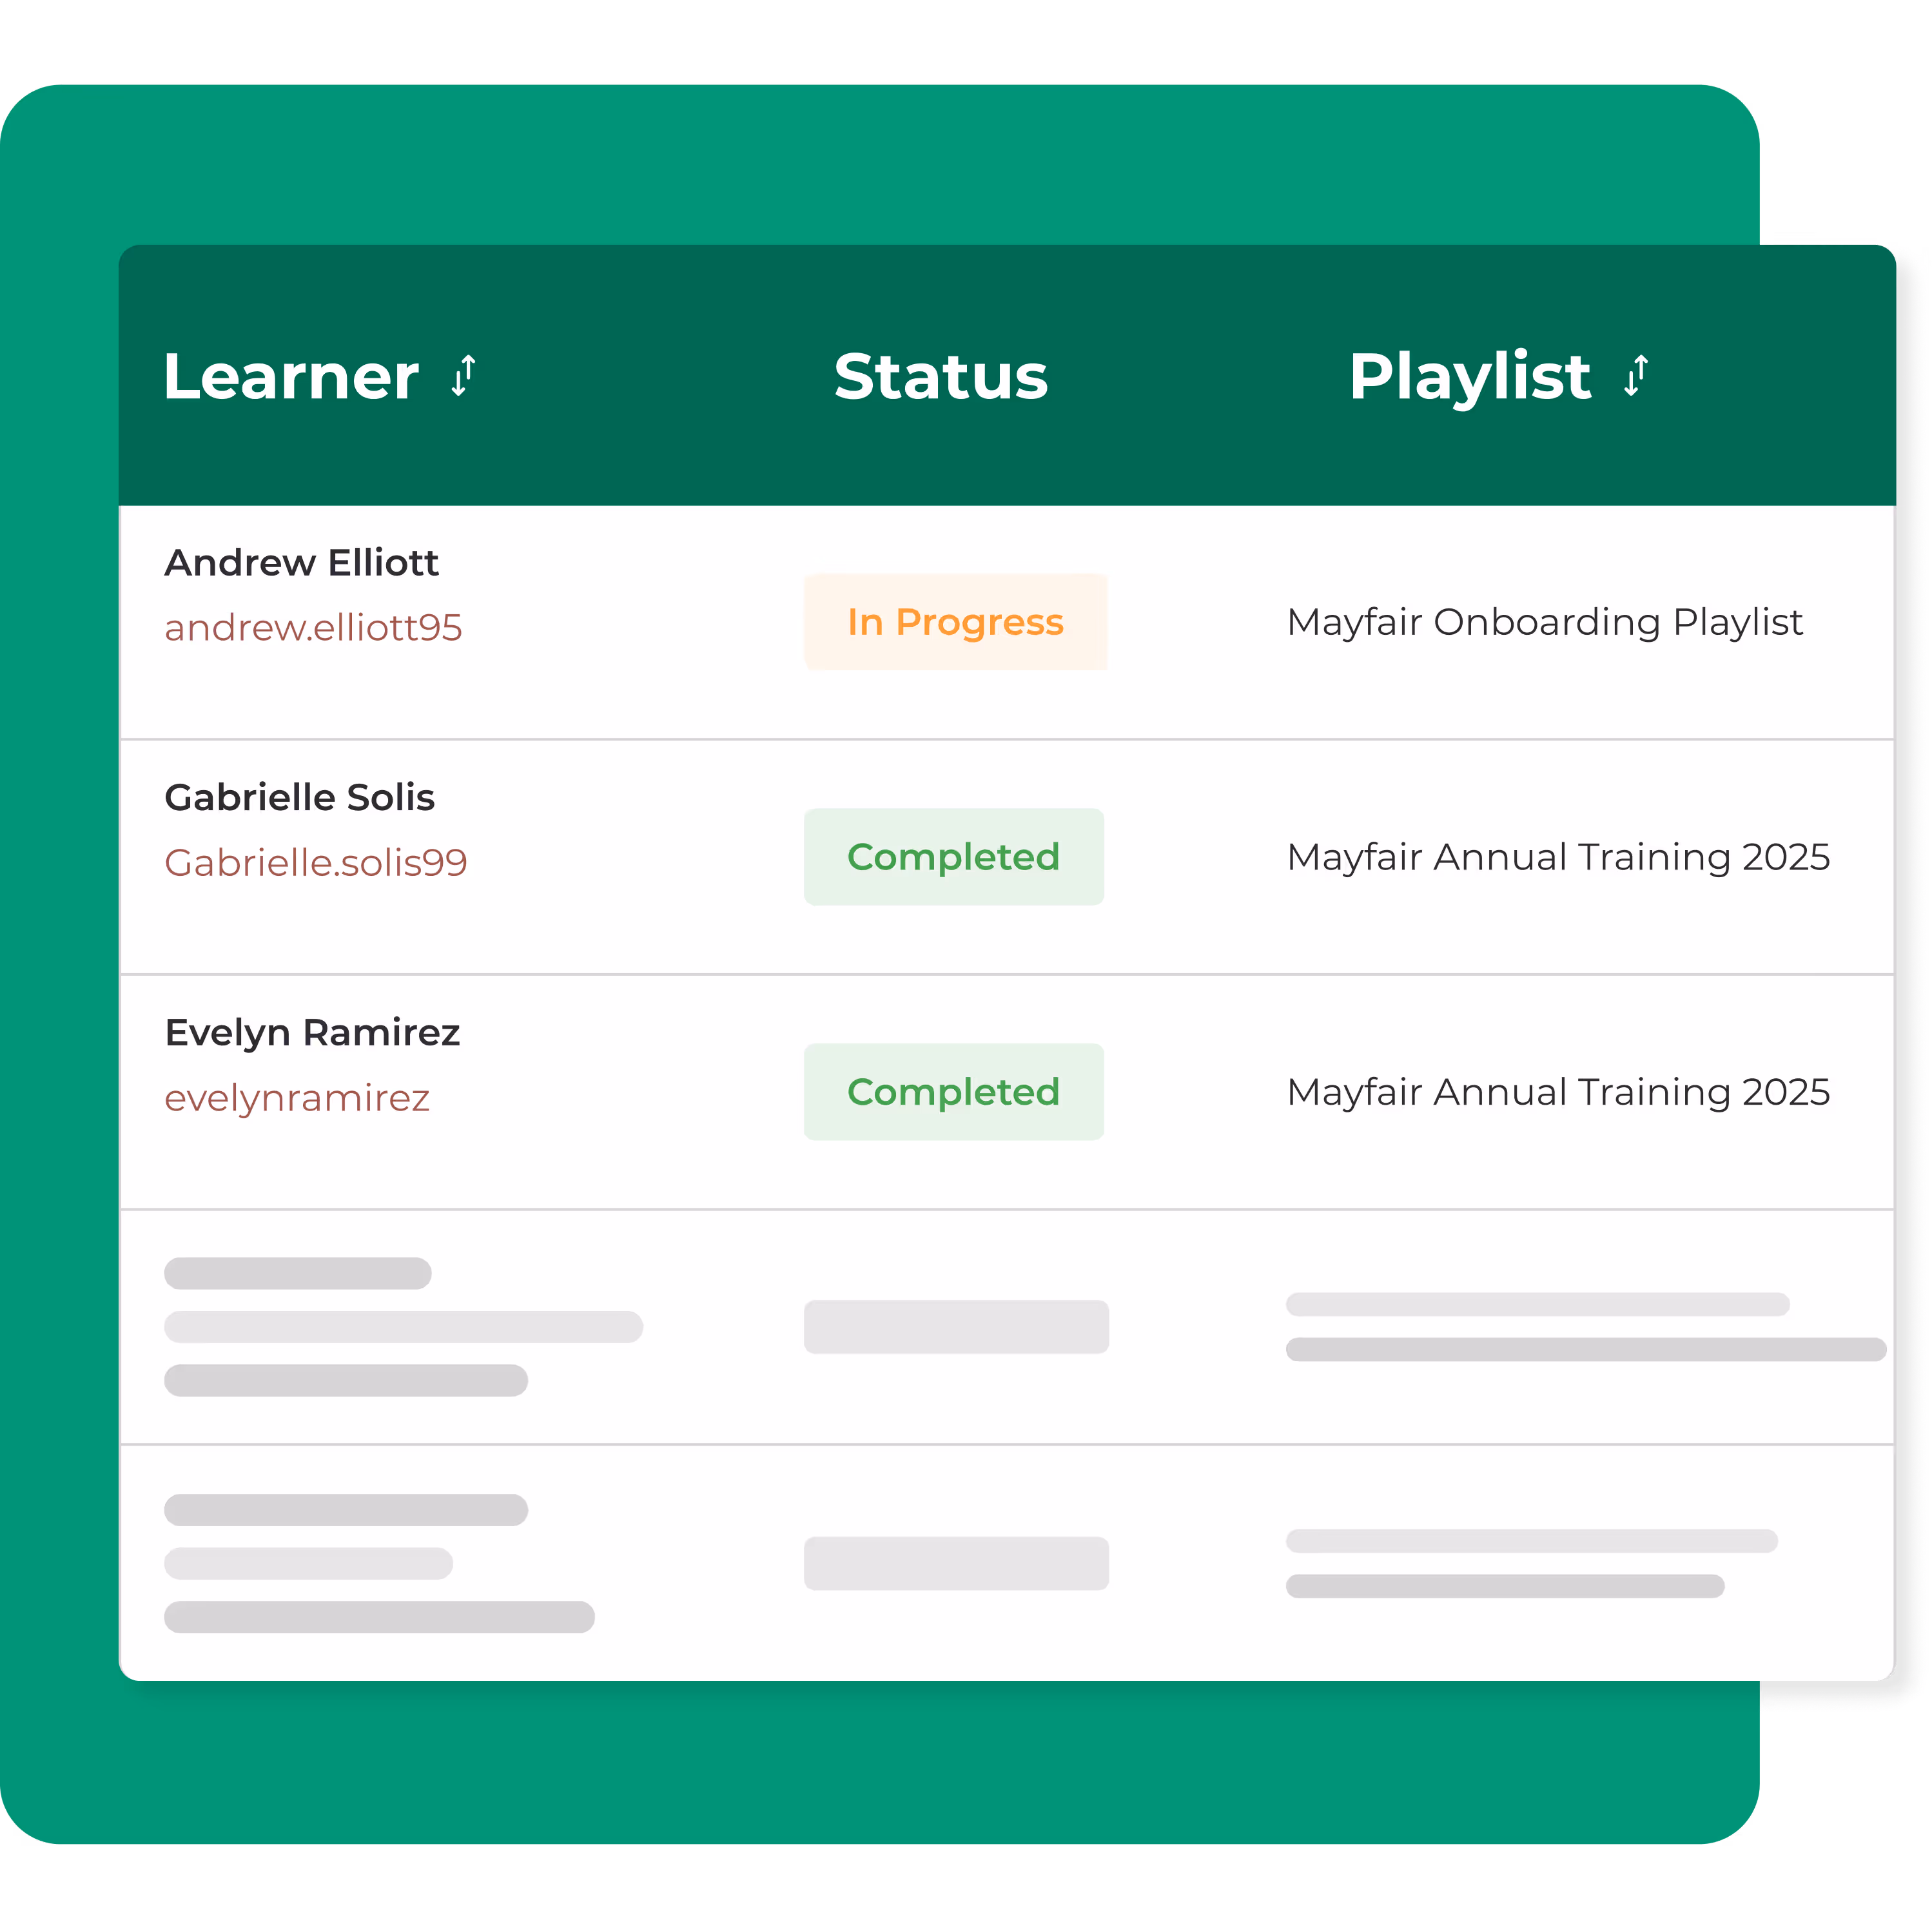
Understand how learners are engaging
The Learner Overview helps you see how your people are progressing, who needs support, and where engagement may be slowing. It is the insight you need to intervene early and support your team.

Dive deeper. Generate detailed reports.
When you need to get hands-on with your data, our reporting tools let you dig further. Run exports, analyse specific segments, and uncover insights beyond the dashboards.
Experience clarity in action
Curious how our dashboards make audits simpler and results easier to show? Let’s take a look together.
